ProGantt
Project Schedule Reporting for Power BI
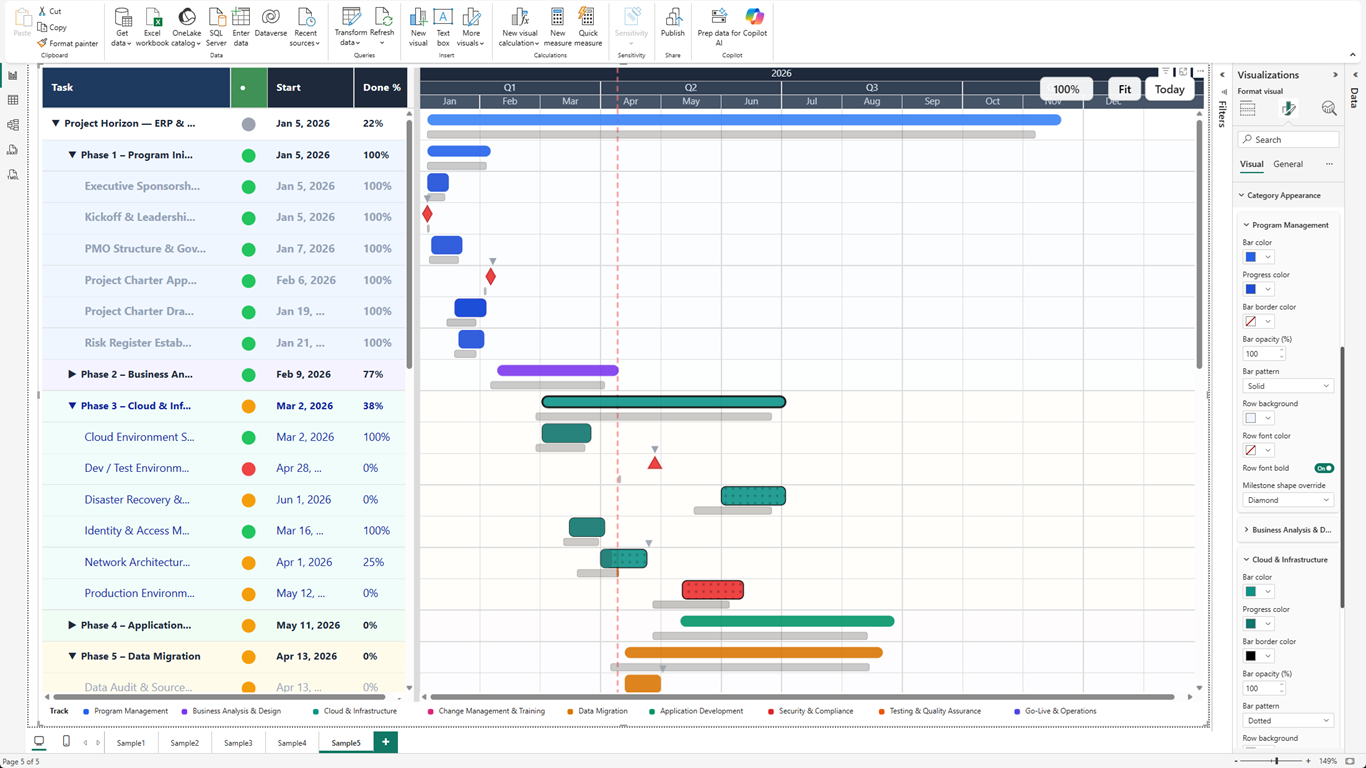
If your project schedule data lives in Power BI, ProGantt helps you turn it into executive-ready reports. Show dependencies, critical path, baselines, milestones, swimlanes, progress, and schedule risk in one interactive visual.
Why ProGantt
Built for project reporting, not just drawing bars
Standard Power BI visuals can show dates, but project leaders need to explain schedule movement, dependency risk, baseline variance, and workstream ownership. ProGantt connects those scheduling concepts directly to Power BI reporting.
Basic timeline charts
Show dates, but rarely explain dependencies, slippage, or schedule risk.
Spreadsheet workarounds
Require manual formatting and are hard to keep aligned with Power BI filters and reports.
Simple Gantt visuals
Usually stop at bars and milestones; ProGantt adds baselines, critical path, swimlanes, and configurable grid reporting.
Key Features
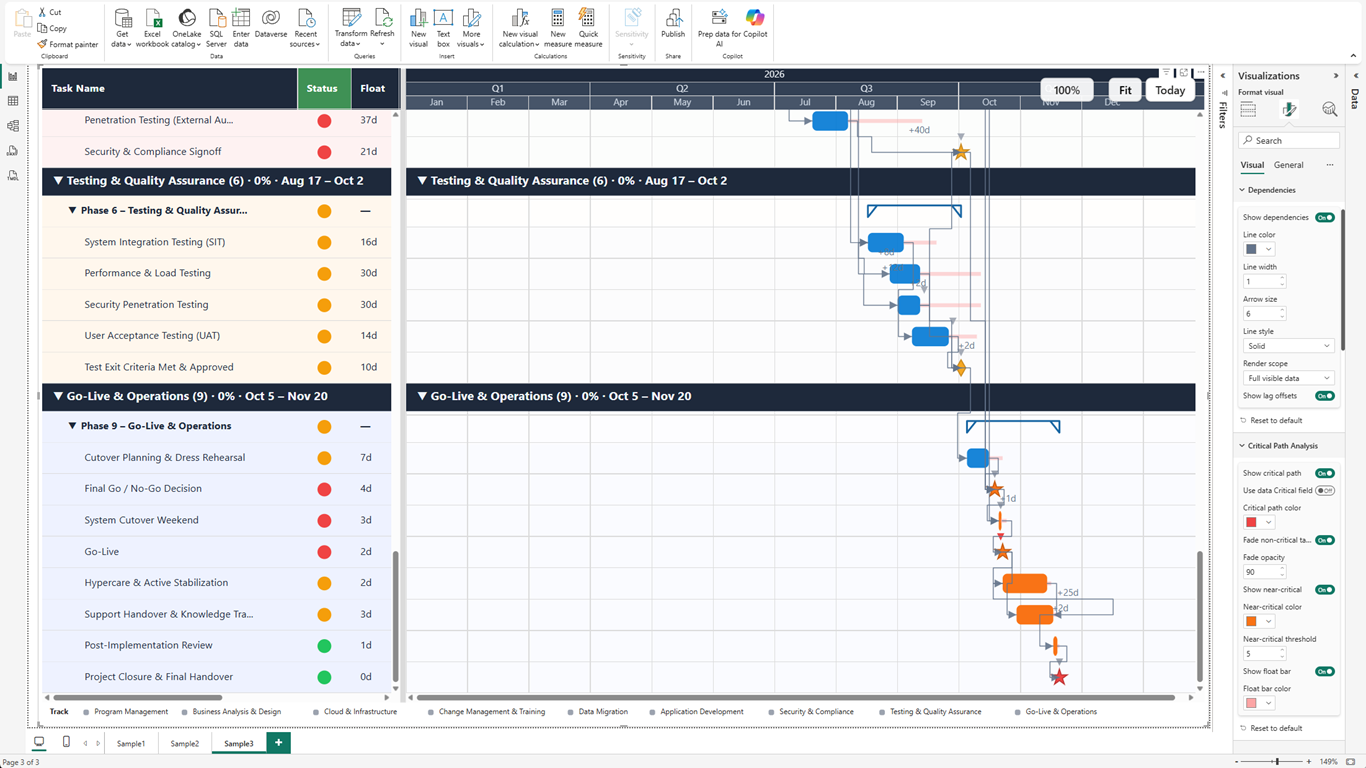
Dependency Mapping
Show why work must happen in sequence with FS, SS, FF, and SF relationships plus lag and lead support.
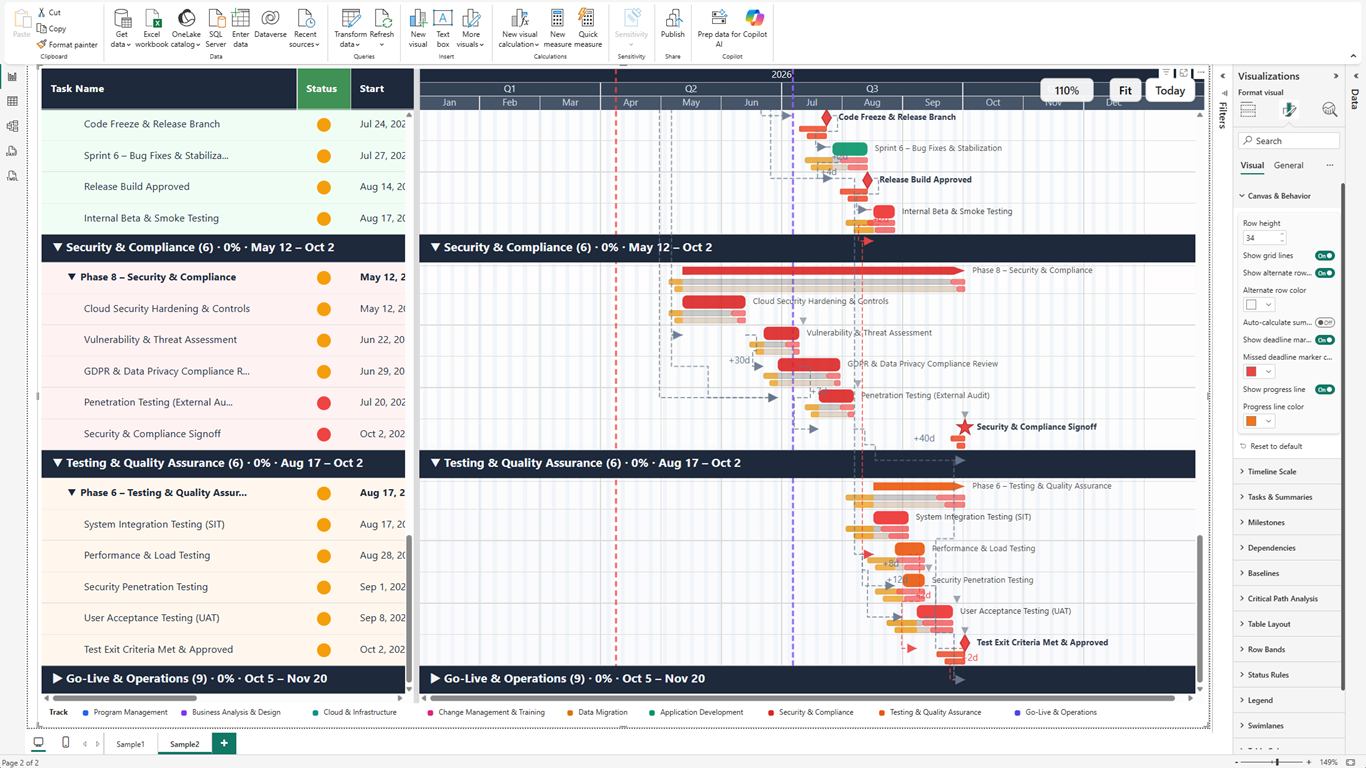
Critical Path Analysis
Highlight the tasks and links that drive the finish date, so leaders can focus on schedule risk.
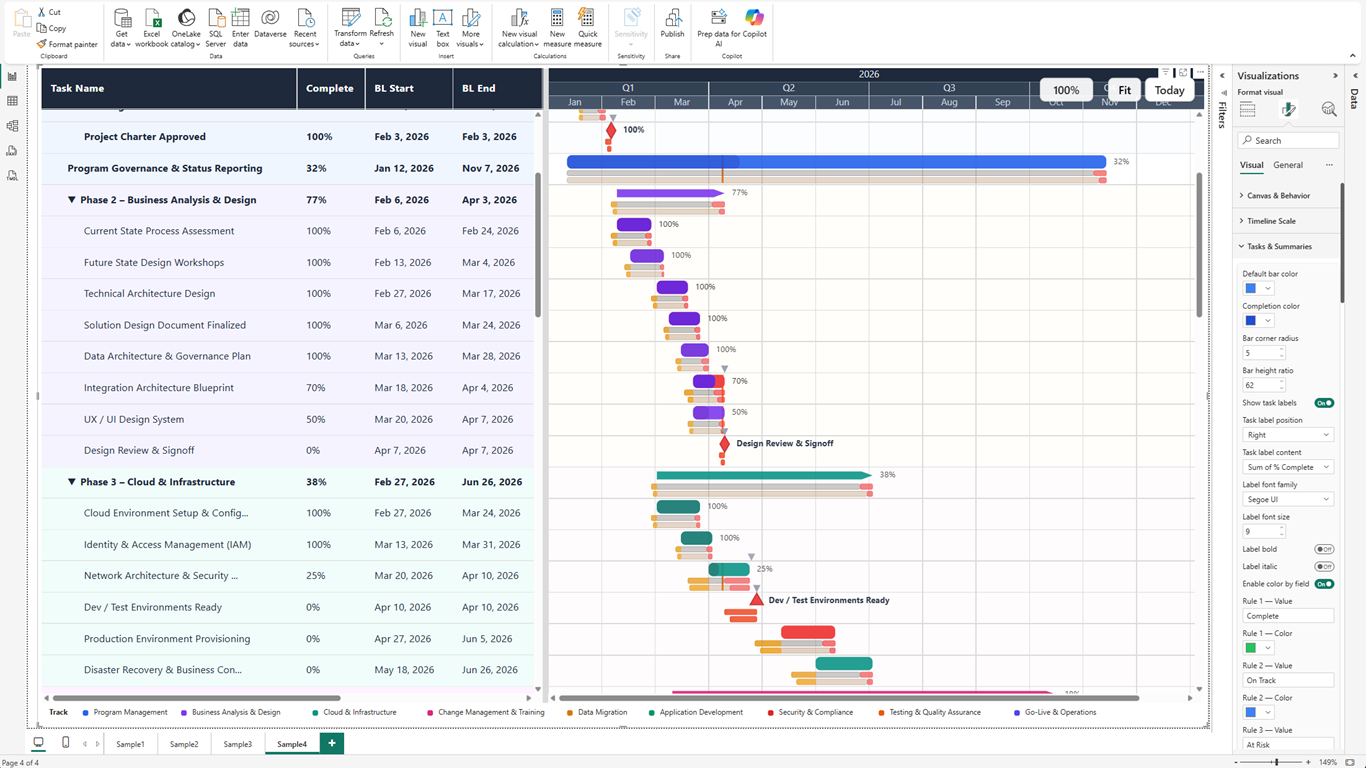
Baseline Variance
Compare planned vs. current schedules and make slippage visible before it becomes a surprise.
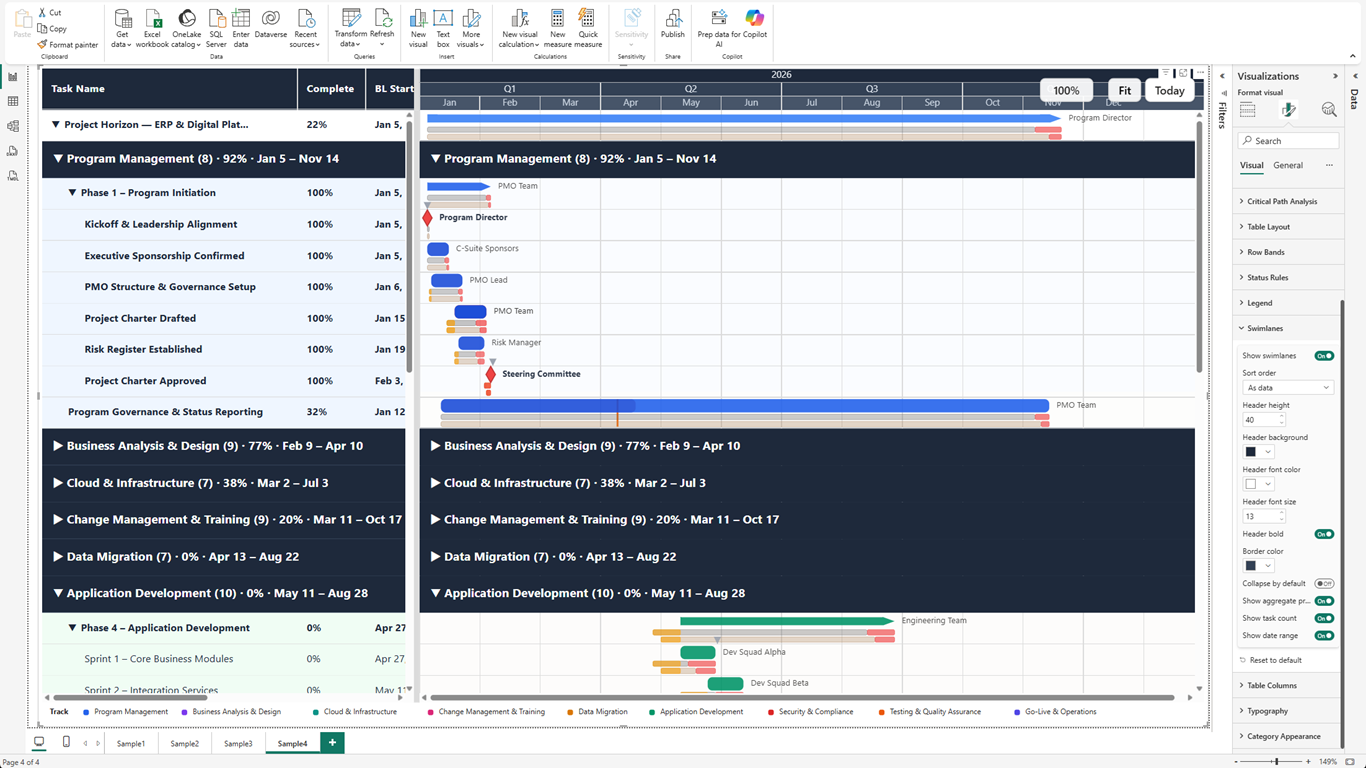
Hierarchy & Swimlanes
Organize large programs by phase, team, workstream, or portfolio category with rollup bars and collapsible lanes.
Milestones & Progress
Show key delivery dates, percent complete, deadlines, and status in one Power BI visual.
Flexible Report Layout
Choose grid columns, rename headers, resize columns, style categories, and shape the report for stakeholders.
Power BI Native Experience
Works with slicers, bookmarks, tooltips, context menus, cross-filtering, export, and report themes.
Enterprise-Scale Rendering
Built for large project models with optimized rendering and reduced-detail modes for dense schedules.
See ProGantt in Action
Who Uses ProGantt
Project managers, PMOs, delivery leads, and portfolio teams use ProGantt when they need trusted schedule reporting inside Power BI, not a separate project tool.
Portfolio Delivery Dashboards
Give executives a single Power BI view of schedule health, milestone progress, and workstream ownership.
Transformation Tracking
Track ERP rollouts, digital transformation, construction, and infrastructure projects with visible dependency chains.
Baseline Reviews
Compare approved plans against current schedules and explain variance with dates, bars, and progress overlays.
Dependency Risk Reviews
Use critical path and total float to identify which tasks can delay the finish date.
Pricing
Free
$0
Core Gantt for Power BI
- Task bars with hierarchy
- Milestones (4 shapes)
- Today line & deadline markers
- Basic column layout
- Dependencies (all 4 types)
- Tooltips
- Limited to 1,000 tasks
Pro
$3.99
per user / month
$39.99 / user / year
Everything in Free, plus:
- Baseline comparison (dual)
- Critical path analysis
- Swimlane grouping
- Advanced conditional formatting
- Category styles & legend
- No watermark in Power BI Service
- Unlimited tasks (up to 500K rows)
Free 30-day trial included
AppSource-certified. No external service calls. Safe for organization-wide deployment.