ProRoadmap
Strategic Product Roadmap for Power BI
A purpose-built roadmap visual for product and strategy teams. Swimlanes by team, status health colors, OKR binding, milestone markers, and a quarter-first timeline that reads like a roadmap — all inside your Power BI reports.
Quarter-First Timeline
Q1–Q4 boundary markers, month labels, and a today line. Strategic resolution — not task scheduling.
Status Health Colors
Bind Status. Configure 8 rules. Every bar recolors. On Track, At Risk, Behind, Done — one card, zero workarounds.
Swimlanes + OKR Binding
Group by team. Show the strategic goal on every row. Collapse lanes in reviews. Built for executive audiences.
See What It Can Do
Click any image to enlarge.
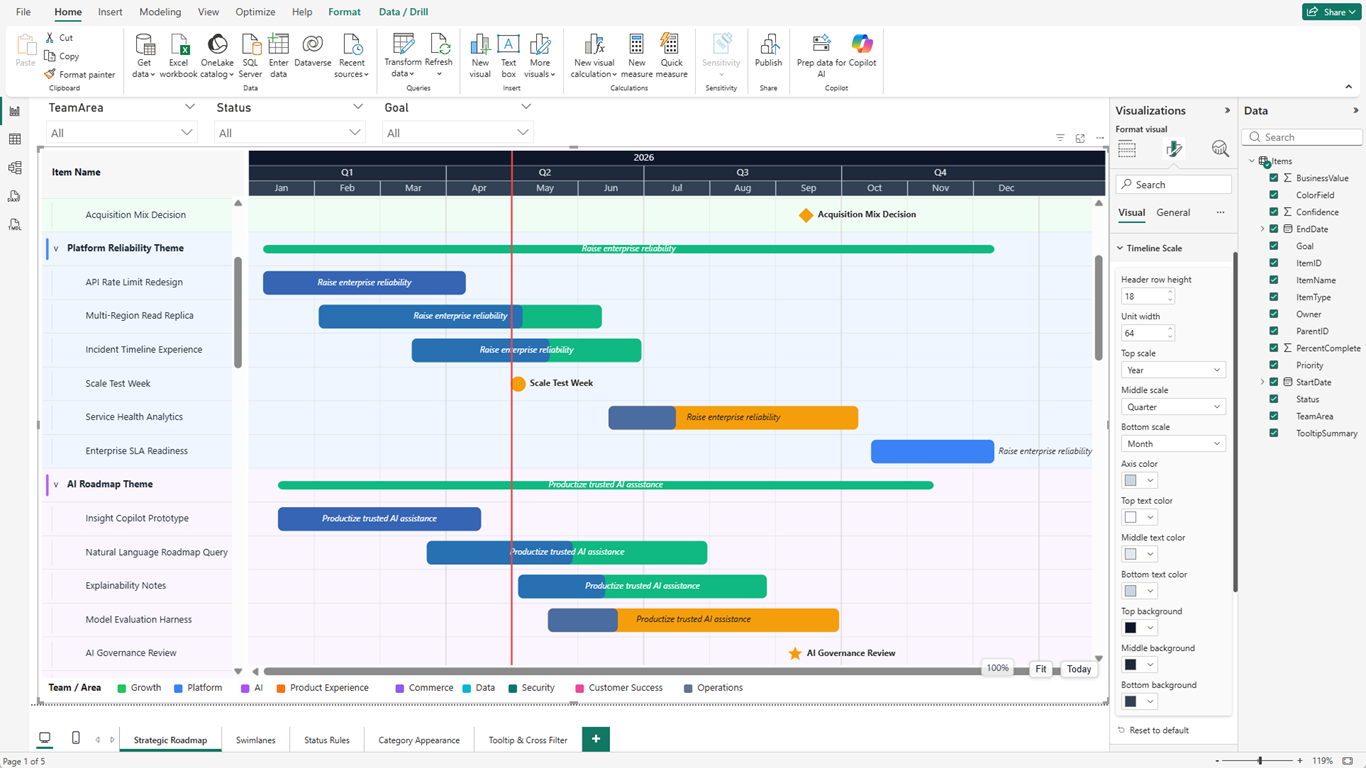
Every team. Every quarter. One view.
Nine teams, eighty roadmap items, and a full year of planning — all in one Power BI visual. Swimlane headers show item count and date range. The today line marks where the organization is right now. Quarter markers make Q1–Q4 boundaries impossible to miss. The legend at the bottom identifies every team color without opening a tooltip.
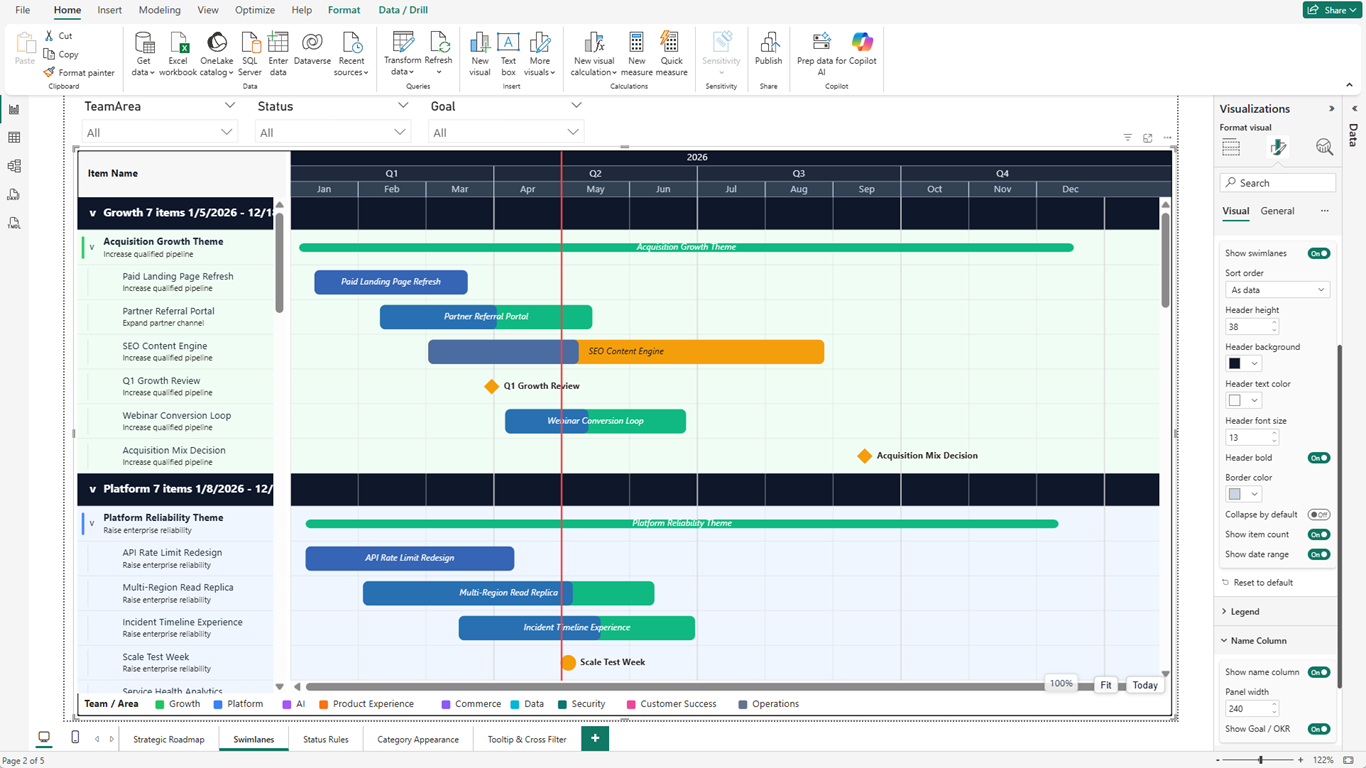
Strategy visible in every row.
The Name Column shows item name and Goal / OKR as a two-line display — no hover required. Theme rows have expand/collapse arrows. The Swimlanes format card controls sort order, header styling, item count display, and date range summary. This is what a strategy review looks like when the data is already in Power BI.
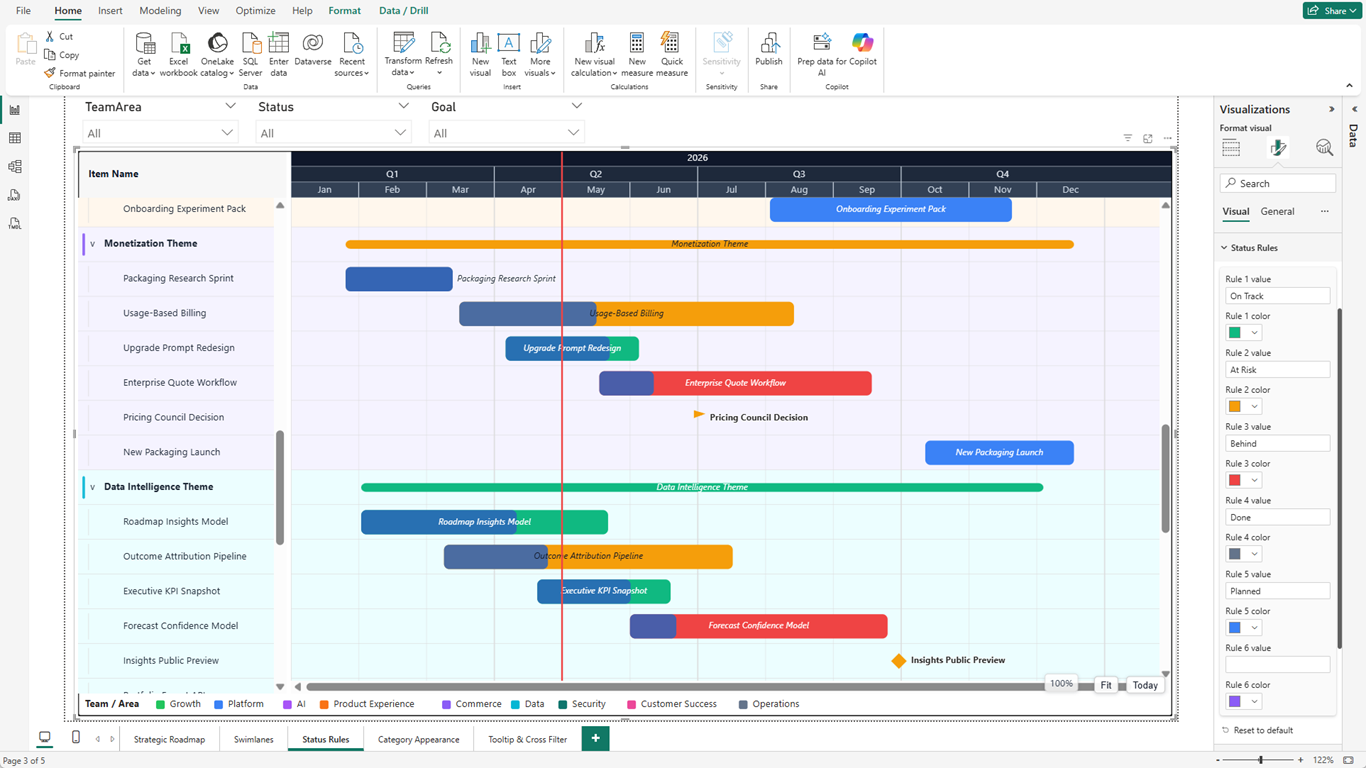
What needs attention? The color tells you.
Five status values. Five rules. Every bar recolored in one card. Green means on track. Amber means watch it. Red means a conversation is needed. Gray means shipped. The Status Rules card is the fastest path from a raw roadmap to an executive health report — no calculated columns, no conditional formatting, no workarounds.
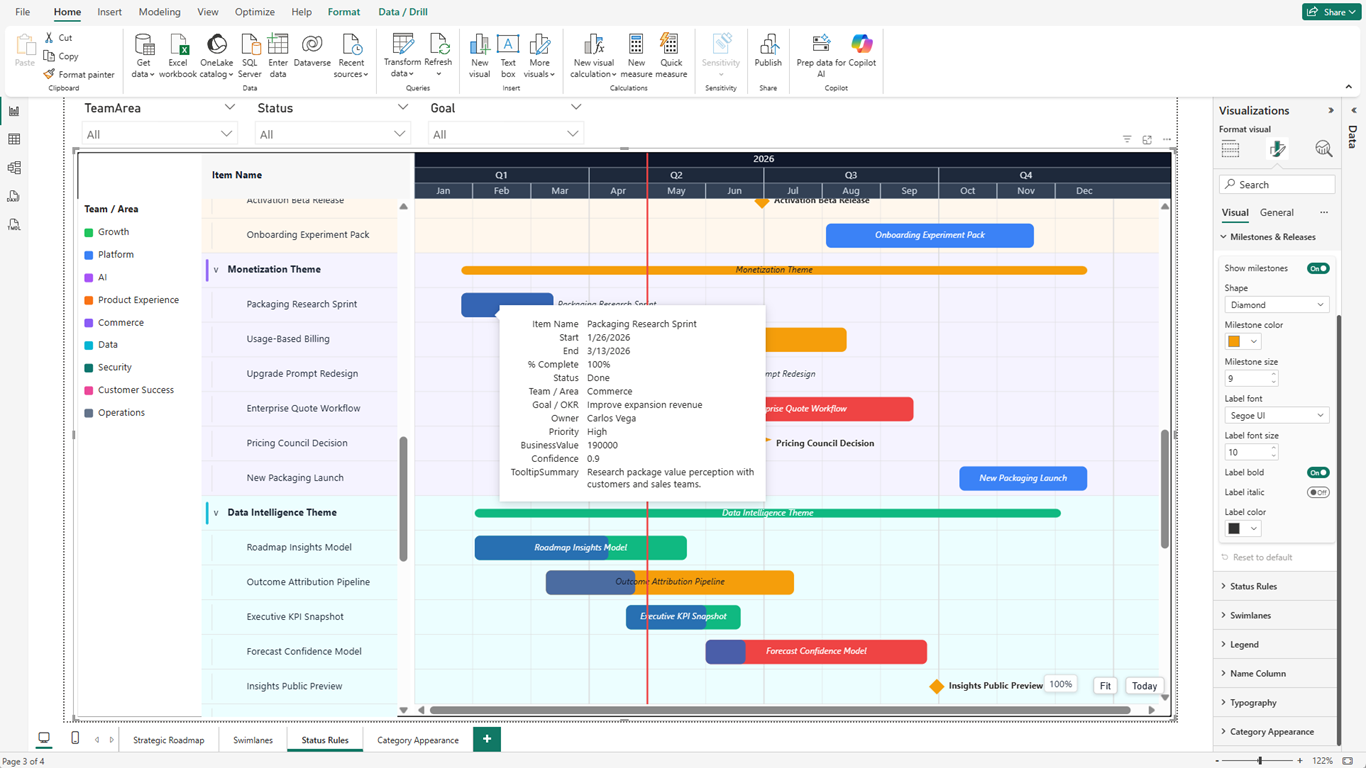
Every stakeholder question. Answered in the tooltip.
Bind Owner, Priority, Business Value, Confidence, and a summary field to Tooltip Fields. Hover any bar and the tooltip surfaces them all. The Milestones & Releases card controls milestone shape, size, and label style — without touching the main bar settings.
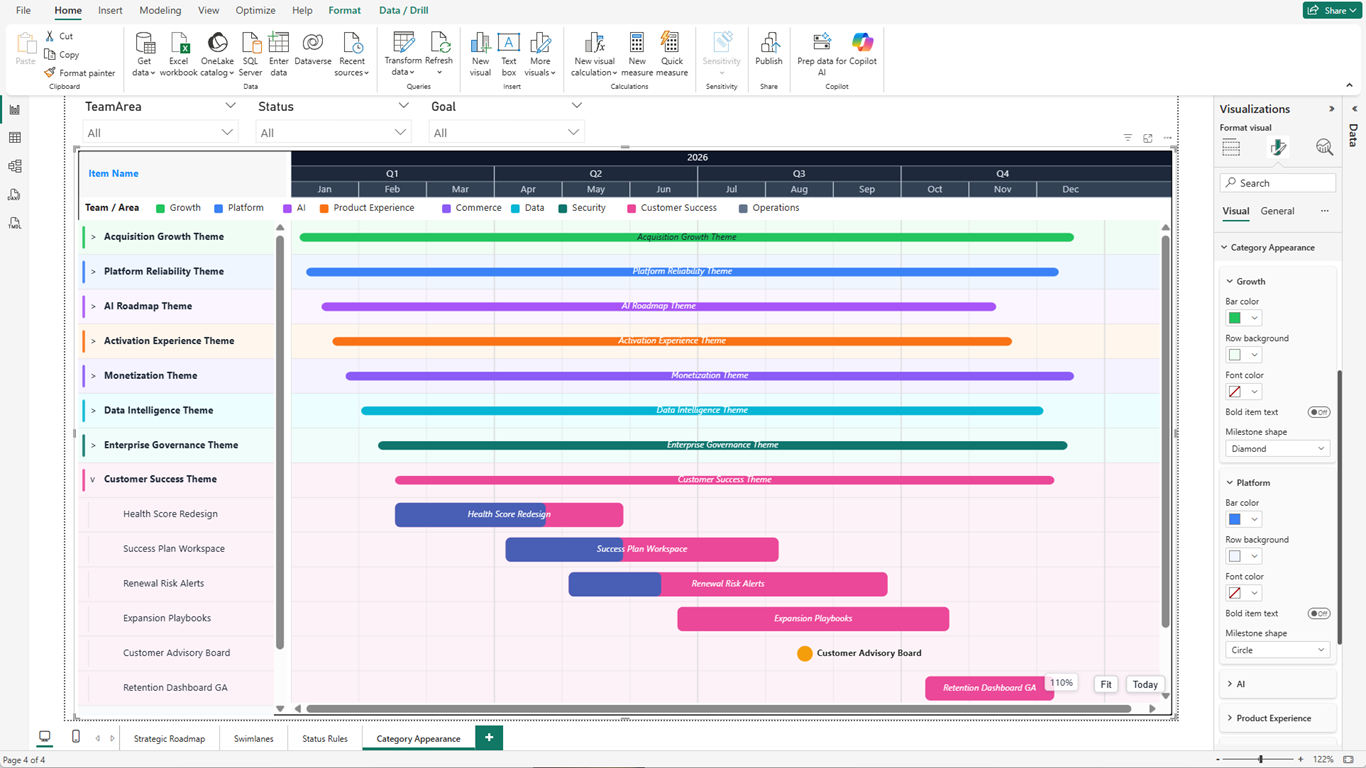
One identity per team. Configured in one place.
Category Appearance generates one group per Team / Area value automatically. Set bar color, row background, font color, and milestone shape independently for each team. Every item, row background, and milestone in that lane updates immediately. Theme-level ribbon bars show the full scope of each strategic theme at a glance.
Built for Product Teams, Not Project Managers
Every feature in ProRoadmap exists because strategy reviews, portfolio meetings, and OKR planning sessions demanded it.
Quarter-First Timeline — Built for Strategy, Not Scheduling
ProRoadmap is designed around the quarter, not the day. The timeline header shows Year / Quarter / Month by default, with bold Q1–Q4 boundary markers across the full chart. You see strategic horizons at a glance — no zooming required.
Status Colors That Answer "What Needs Attention?" Instantly
Bind a Status column and configure up to 8 rules: On Track → green, At Risk → amber, Behind → red, Done → gray. Every bar recolors immediately. No calculated columns, no conditional formatting workarounds — one field, one card, done.
Swimlanes That Actually Organize a Portfolio
Bind Team / Area and every lane becomes a labeled section with item count and date range in the header. Collapse the lanes you are not presenting. Sort by team name, data order, or earliest start date. The roadmap stays organized even with 9 teams and 80 items.
Theme → Epic Hierarchy with Expand / Collapse
Parent roadmap items render as thin ribbon bars spanning all their children. Child items indent underneath. Click the arrow to collapse a theme — its ribbon stays visible, its children disappear. Executives see the summary; analysts drill in.
OKR / Goal Subtitle in Every Row
Bind a Goal / OKR column and turn on Show Goal in the Name Column. Every item shows its strategic objective as a second line — right in the roadmap, without opening a tooltip. Strategy reviews stop asking "why are we building this?"
Milestone Markers in Five Shapes
Zero-duration items render as geometric markers: diamond, triangle, circle, star, or flag. Set the shape globally or override it per team in Category Appearance. Status colors apply to milestones too — a red diamond means a missed deadline without any legend.
Category Appearance — One Color Identity Per Team
Assign a bar color, row background, and milestone shape to each Team / Area value. The visual generates one settings group per team automatically — up to 32. Change one team's color and every bar, background, and milestone in that lane updates.
Dynamic Bar Labels — Show Any Field on the Bar
Bar labels are not limited to item names. Switch the Label Content dropdown to Status, Owner, Priority, Goal / OKR, or any bound Tooltip Field. One setting change turns a roadmap into a resource view or a priority heatmap without rebuilding anything.
Progress Overlays Without Extra Calculations
Bind a % Complete measure — as a fraction (0.46) or whole number (72). ProRoadmap normalizes both and draws a progress fill inside each bar. No DAX needed. The overlay respects bar color and status color, staying clearly visible in all configurations.
ProRoadmap vs ProGantt — Know Which to Use
They look similar. They are built for completely different jobs.
| Dimension | ProRoadmap | ProGantt |
|---|---|---|
| Time granularity | Quarter / Month | Day / Week / Month |
| Primary audience | Product managers, executives | Project managers, engineers |
| Color system | Status health rules | Category, CPM, color-by-field |
| Dependencies | Not supported | FS, SS, FF, SF with lag |
| Critical path | Not supported | Full forward/backward CPM |
| Baselines | Not supported | Baseline bars with variance |
| Hierarchy | Theme → Epic (2 levels) | Unlimited depth via Parent ID |
| Swimlanes | By Team / Area | By any category field |
| OKR / Goal binding | Built-in subtitle field | Via tooltip or custom column |
| Milestone shapes | 5 shapes, per-team override | Diamond only |
| Ideal data source | Product backlog, OKR tools | Project schedules, WBS |
Need both? Both visuals can coexist on the same Power BI report page and cross-filter each other.
Who Uses ProRoadmap
Product managers, strategy leads, and BI teams who need a Productboard-quality roadmap view without leaving Power BI — or paying for another tool.
Product Portfolio Reviews
Show all initiatives across all product teams on one roadmap. Use swimlanes to separate teams, status colors for health, and milestone markers for release gates. Collapse completed or low-priority lanes during the review.
OKR-Aligned Planning
Bind your OKR or goal column to Goal / OKR. Every roadmap item shows the strategic objective it supports — right in the name column, visible without hovering. Strategy reviews stop asking "why are we building this?"
Executive Quarterly Business Reviews
Start with all swimlanes collapsed. Walk through each team by expanding one lane at a time. The milestone markers and status colors tell the health story. The Goal / OKR subtitle provides the strategic context.
Release Planning
Mark release gates as milestone rows (zero-duration items with Item Type = release). Configure a distinct milestone shape per team. Status colors show whether each release is on track. The today line shows where you are in the quarter.
Multi-Team Dependency Visibility
Use swimlanes to organize by team and the theme/child hierarchy to show which epics belong to which strategic initiative. Connect ProRoadmap to slicers for team or status to let stakeholders filter to their area of concern.
Portfolio-Level Progress Reporting
Bind % Complete to show delivery progress as a fill inside each bar. The Category Appearance row background gives each team a distinct visual lane. One glance shows which teams are ahead and which are at risk.
Pricing
Free is fully functional for individual use. Pro unlocks swimlanes, category appearance, and portfolio-scale features.
Free
$0
Always free, no trial required
- Up to 50 roadmap items
- Quarter-first timeline (Year / Quarter / Month)
- Today line and quarter boundary markers
- Roadmap bars, theme ribbon bars, milestones
- 4 Status color rules
- Progress overlays (% Complete)
- Cross-filtering, bookmarks, tooltips
- Two-level hierarchy (Theme → Child)
Pro
$1.99
per user / month
$19.99 / user / year
Everything in Free, plus:
- Unlimited roadmap items
- Swimlanes — group by Team / Area with collapse
- Category Appearance — per-team color, background, milestone shape
- 8 Status color rules
- Color-by-Field — 8 configurable rules on any field
- Legend strip — top, bottom, or left position
- Goal / OKR subtitle in Name Column
- Dynamic bar labels — show any bound field on the bar
- Dark theme and high-contrast mode
- No watermark in Power BI Service
Free 30-day trial included
Microsoft-certified. No external service calls. Safe for organization-wide deployment.